The Week Ahead
This week, participants will receive flash PMI readings from S&P, along with durable goods data on Wednesday, Q4 GDP growth on Thursday, and the core personal consumption expenditures price index for February—the Federal Reserve’s preferred measure of inflation—on Friday.

The IPO market will be in focus as cloud computing firm CoreWeave (CRWV) debuts on the Nasdaq. Backed by Nvidia (NVDA), the company aims to raise up to $2.7 billion with a valuation target of $26 billion—a key test for the struggling AI sector.
Participants will also monitor developments on U.S. reciprocal tariffs set to take effect on April 2.
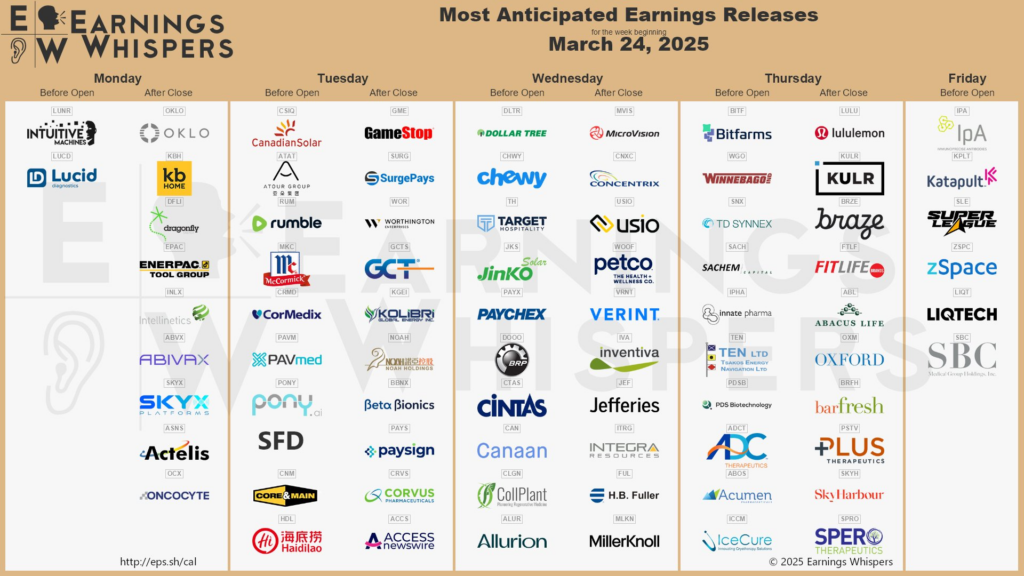
On the earnings calendar, key names set to report include GameStop (GME), which is highly followed by retail investors; Dollar Tree (DLTR), a major discount retailer; Chewy (CHWY), a key e-commerce player in the pet care industry; and Lululemon (LULU), a major athletic apparel company relevant for consumer discretionary spending.
Market Regime
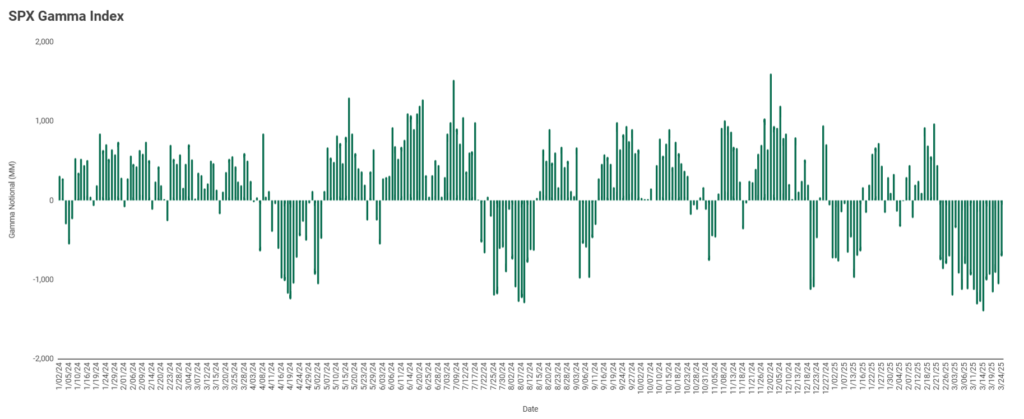
To start the week, the Gamma Index (Dealer Gamma) is negative at -710.0M (ref: 5667) trading below the 5700 Flip.
Dealer Dynamics 101
Above the Flip (positive gamma), dealers are long gamma and hedge by buying weakness and selling strength, leading to lower volatility, stronger levels, higher pin predictability, improved liquidity.
Below the Flip (negative gamma), dealers are short gamma and hedge by selling weakness and buying strength, resulting in higher volatility, weaker levels, lower pin predictability, reduced liquidity.
Levels
Last Friday was Triple Witching, with $4.7T in notional options exposure removed and around 30% of S&P 500 gamma unwound. We now look toward day-to-day open interest change data to identify where new positions are being established and how key options metrics are shifting.
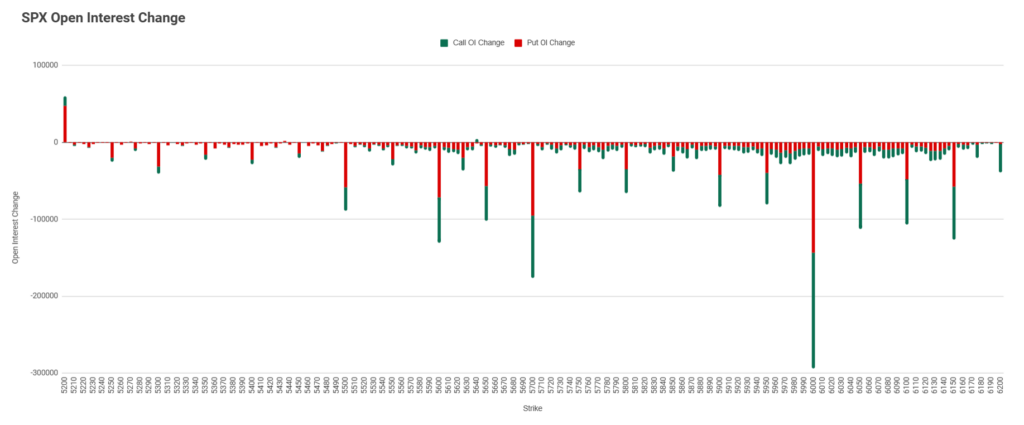
Are participants demanding calls or puts, and at what strikes? Far out-of-the-money options imply expectations of greater volatility, while closer-to-the-money options suggest lower volatility — similar to the logic used when analyzing 0DTE options volume on an intraday basis.
SPX has broken through two downsloping structures, a bullish indication, with another downsloping structure overhead (red) which may act as target and resistance.
The 5700/5715 zone has been a strong resistance. Post-OPEX, the removal of call open interest at 5700 has weakened this zone (see chart above), requiring less demand to break and hold above. Additionally, the next test will be the fifth attempt. As we know, the more times a level is tested, the more likely it is to break. A move above opens the door to 5750, 5770 Gap Fill then 5800/5820.
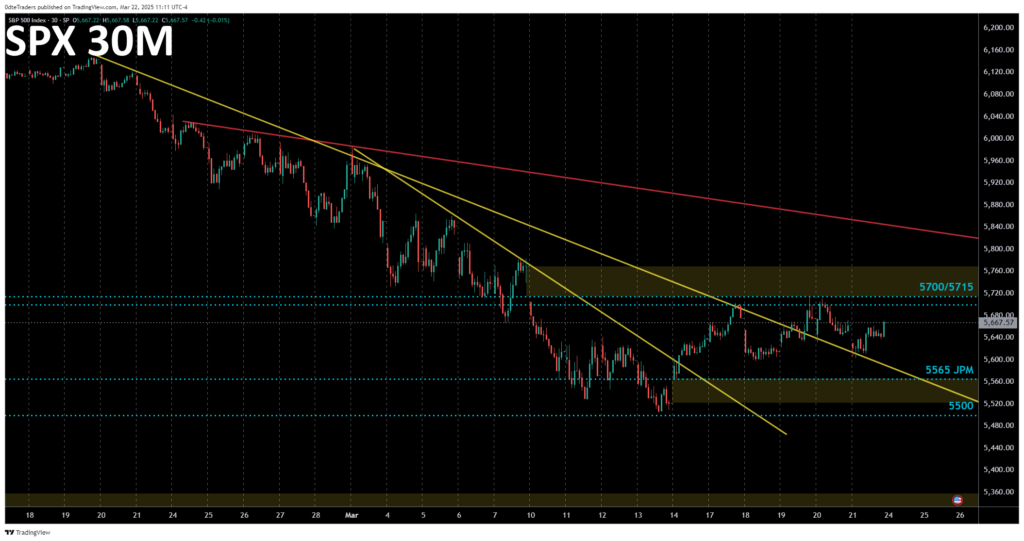
We had three opportunities to sell the 5715 Flip from the call side last week. However, given the change in dynamics, reclaiming the Flip now has a much higher probability. Therefore, this trade should be approached with caution or reversed if the Flip is reclaimed—meaning we could begin selling the put side. Reclaiming the Flip often sparks a squeeze rally, but with the S&P already up 1.2% in the premarket, the extent of further upside remains uncertain.

On the downside, 5565 is the JPM JHEQX put strike expiring on 3/31. It already holds the highest net negative put gamma, and its influence will strengthen if we remain within its vicinity, acting as a downside target and major support level. This, along with 5500, should provide support through the end of March. 5650 and 5600 also remain large net negative gamma levels.
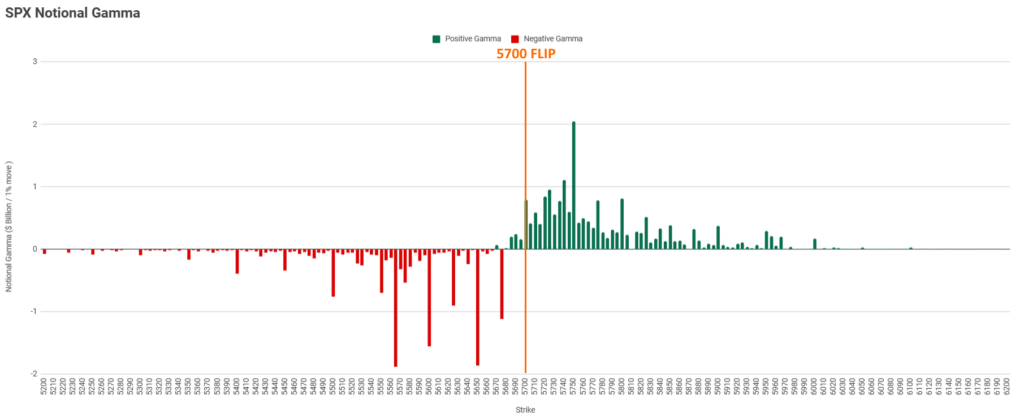
<JPM JHEQX 03/31 Put Collar, 40.0k, 4700 puts, 5565 puts, and 6165 calls>
The JPM JHEQX put collar trade is a quarterly options strategy that involves buying and selling various SPX options contracts to protect (or “hedge”) long holdings in technology equities—primarily MSFT, AAPL, and GOOGL—for the JPMorgan Hedged Equity Fund.
Trading Trendlines
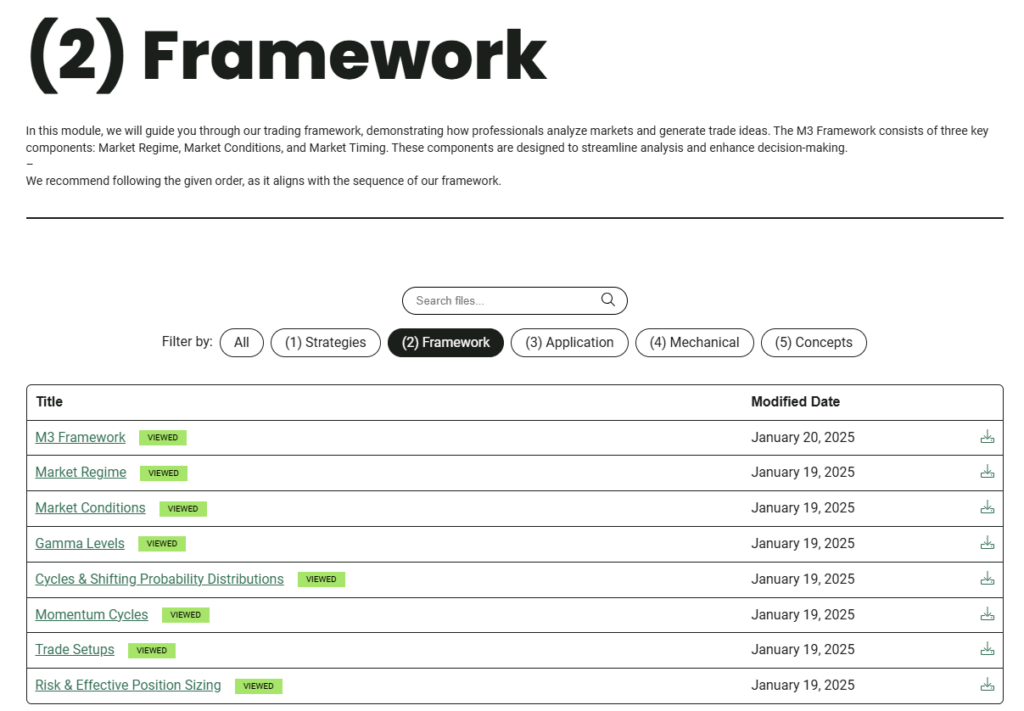
Over the past four weeks, we’ve been focusing a lot on trading trendlines. We wrote a detailed lesson on this topic, providing six setups for filtering and improving the probability of trendline trades. See the attached lesson below.
If you would like more content like this, a membership to 0DTE Traders includes a comprehensive course with 90+ lessons covering 5 modules, ensuring our members gain a deep understanding of what moves the markets, how to identify opportunities, and effectively manage risk.
This week, we’re offering our newsletter subscribers a 10% discount to join the team. Simply use the code 0DTETEN at checkout. This offer is valid until March 28, 2025.

Volatility
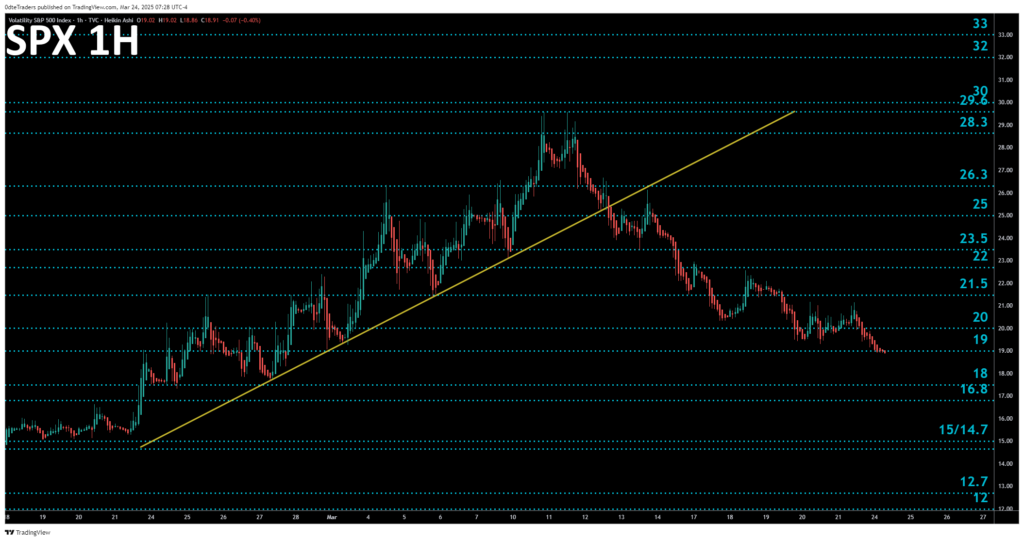
Since a signed tariff deal has not been reached, the April 2 reciprocal tariff deadline poses a jump risk for volatility and with he VIX at a three-week low, S&P 500 puts are now relatively cheap. A key signal for further volatility contraction would be reclaiming the Flip level, where dealers shift to long gamma, suppressing realized volatility and attracting volatility sellers. However, if this occurs, we don’t expect this to be sustained until there is clear resolution on the tariff front.
VIX levels: 12/12.7, 14.7/15, 16.8/18, 19, 20, 21.5/22, 23.5, 25, 26.3, 28.3, 29.6/30, 32, 33, 35.
Join The Team
Gain exclusive access to our daily newsletter, live morning meetings, quality trade ideas, trading tools, data, and in-depth education—everything you need to stay ahead of the market and achieve your trading objectives.
Disclaimer: 0dteTraders does not provide, and no portion of our Content purports to be, individualized or specific investment advice, and 0dteTraders does not provide investment and trading advice to individuals. All information provided by 0dteTraders is general in nature and is made without regard to individual levels of sophistication or investment and trading experience, investment preferences, objectives, or risk parameters and without regard to the suitability of the Content for individuals or entities who may access it.
No information provided by 0dteTraders should be construed as an offer to sell or a solicitation of an offer to buy any security or investment vehicle, nor should it be construed as tailored or specific to you or any reader or consumer thereof. You understand and agree that our content does not constitute specific recommendations of any particular investment, security, portfolio, transaction, or strategy, nor does it recommend any specific course of action is suitable for any specific person or entity or group of persons or entities.
0dteTraders research Content is based upon information from sources believed to be reliable. 0dteTraders is not responsible for errors, inaccuracies, or omissions of information; nor is it responsible for the accuracy or authenticity of the information upon which it relies